How to read your habit statistics: streaks, rates and trends
Understand completion rates, streaks, the pillar tower and weekly consistency so you can see which habits are sticking and which need help.
5 min read
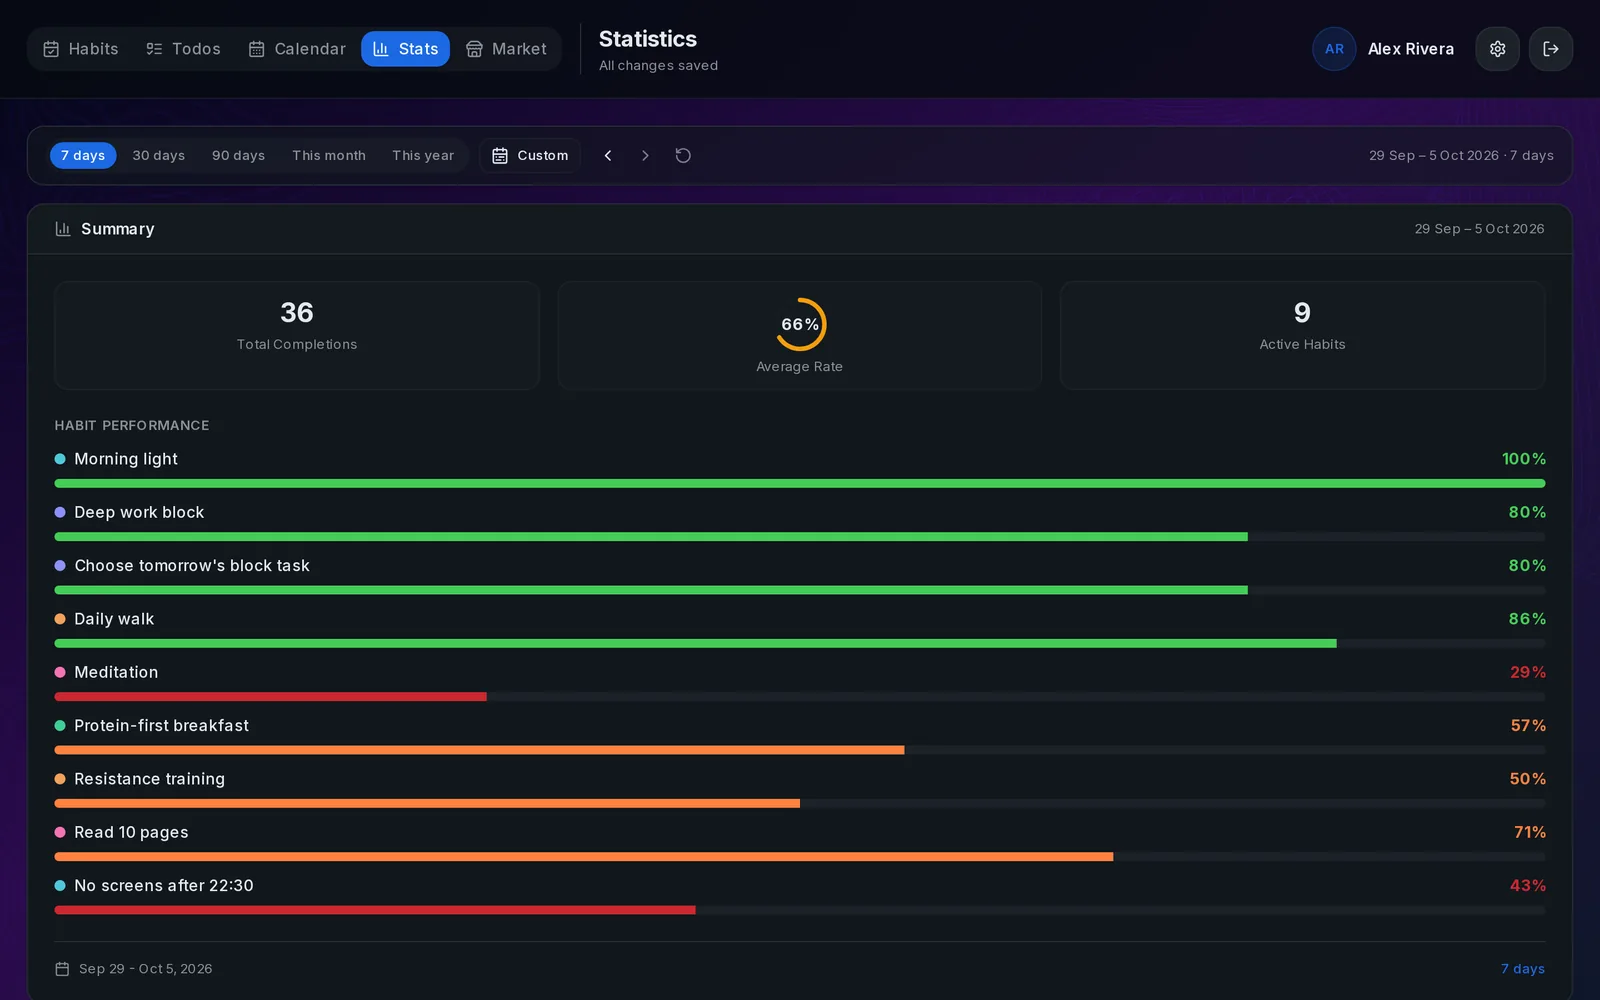
Pick a time range
Statistics cover the last 7, 30 or 90 days, this month, this year or a custom range. Seven days answers "how's this week going"; 90 days shows whether a habit has really stuck.
Completion rate per habit
The summary shows total completions, the average rate and how many habits are active. Below it, every habit gets a bar with its rate for the period: green is on track, orange needs attention, red is slipping. Only scheduled days count, so a weekday habit isn't penalised on weekends.
Streaks
A streak counts consecutive scheduled days. Missing a day you weren't scheduled for doesn't break it. Days you log afterwards, from the tracker or through ChatGPT or Claude, count too, even from before you created the habit.
Trends, heatmap and consistency
The completion trend shows daily totals; the year overview is a heatmap of every day; weekly consistency marks perfect weeks and the ones under 50%. Together they tell you whether a dip was one bad week or a slow slide.
On your phone
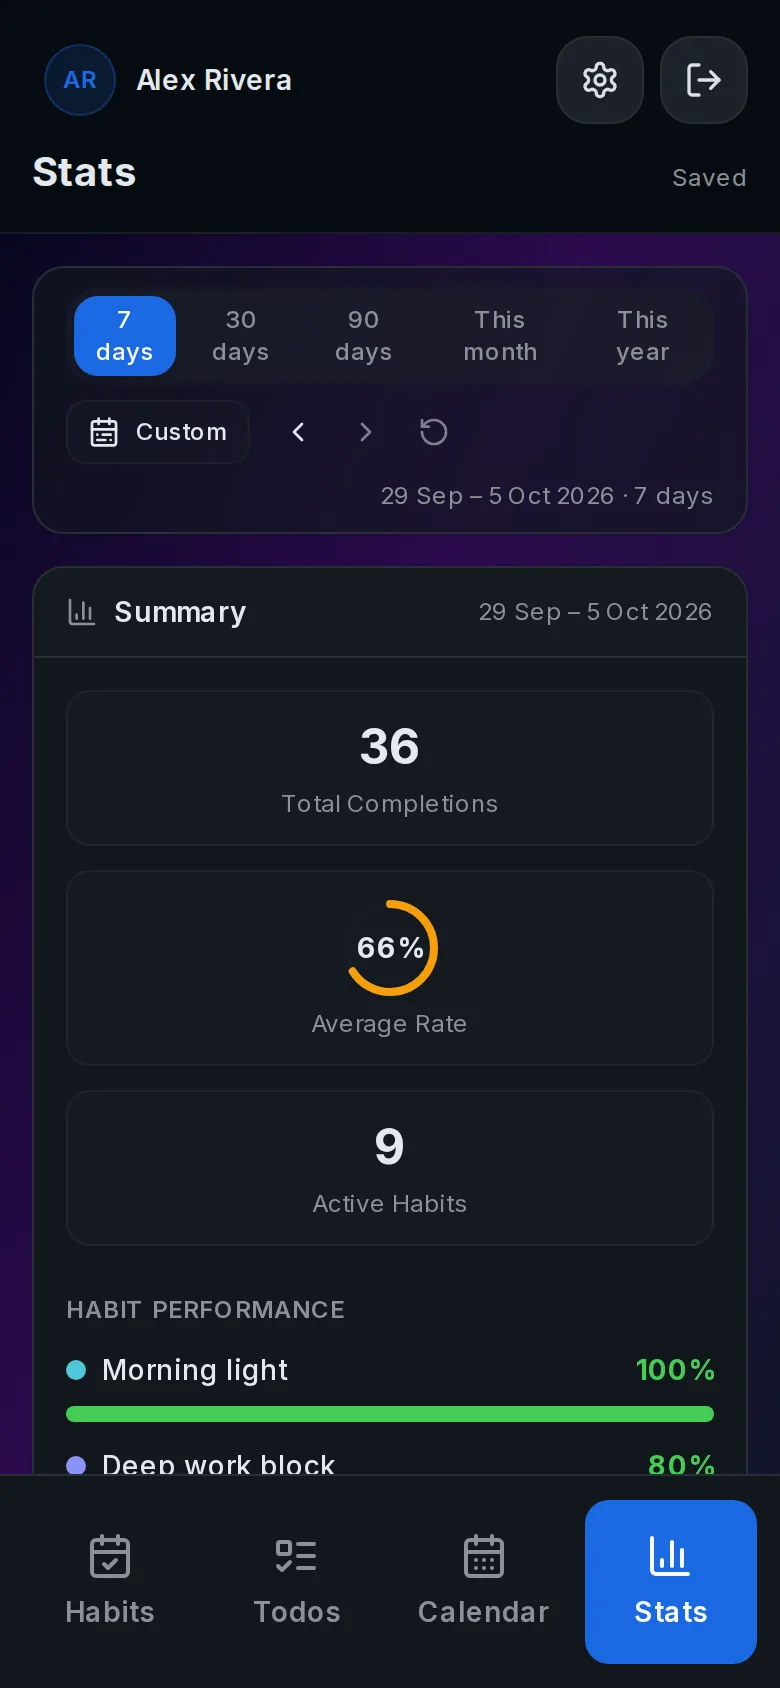
The same statistics work on mobile, one card per section.
Ask instead of reading
With an assistant connected, ask "how did this week go compared to last?" or "which habit am I struggling with?". It reads the same numbers and answers in a sentence or two.
Related guides
Build a morning routine from evidence-based protocols
Pick protocols with the evidence attached and they become ordinary daily habits you can track and edit.
Log habits by voice with ChatGPT or Claude
Hands-free habit tracking: say it out loud while you make coffee, and the tracker updates instantly.
How to track your habits with ChatGPT
Connect ChatGPT once and it can read your habits, mark them done and tell you how your week went.